
Ethereum extended its rally above $3,600 level against the US Dollar. ETH price is consolidating gains and it might surge again if it clears $3,575.
- Ethereum started a fresh increase above the $3,550 resistance level.
- The price is now trading above $3,500 and the 100 hourly simple moving average.
- There is a short-term bearish trend line forming with resistance near $3,575 on the hourly chart of ETH/USD (data feed via Kraken).
- The pair could continue to rise as long as it is above the $3,420 support zone in the near term.
Ethereum Price Remains In Uptrend
Ethereum extended its increase above the $3,500 resistance zone. ETH was able to climb above the $3,550 level and the 100 hourly simple moving average.
During the increase, there was a break above a key bearish trend line with resistance near $3,475 on the hourly chart of ETH/USD. The pair even cleared the $3,600 zone. A high is formed near $3,628 and it is now correcting gains.
Ether corrected lower below the $3,600 level. It traded below the 23.6% Fib retracement level of the recent wave from the $3,343 swing low to $3,628 high.
It is now consolidating near the $3,500 zone. An immediate resistance on the upside is near the $3,550 level. The first major resistance is near the $3,575 level. There is also a short-term bearish trend line forming with resistance near $3,575 on the same chart.
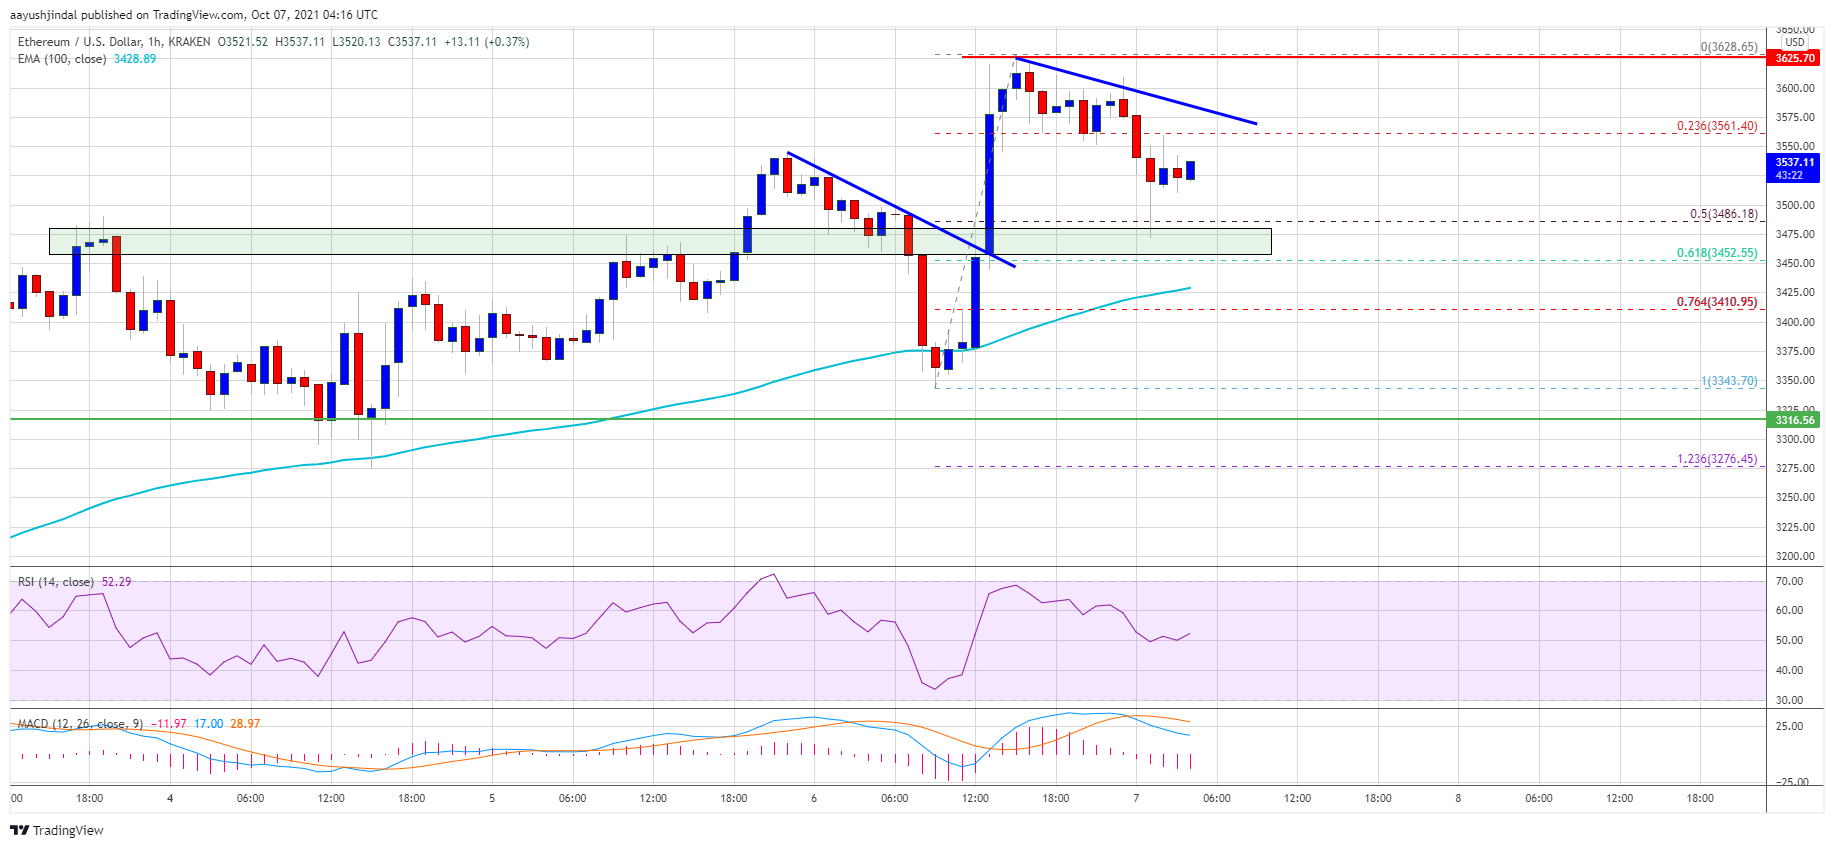
Source: ETHUSD on TradingView.com
The next major resistance is near the $3,600 level, above which the price might accelerate higher. In the stated case, the price may possibly rise towards the $3,700 level. The next key resistance could be $3,800.
Dips Limited in ETH?
If ethereum fails to continue higher above the $3,550 and $3,575 resistance levels, it could start a fresh downside correction. An initial support on the downside is near the $3,500 level.
The first key support is now forming near the $3,480 level. It is close to the 50% Fib retracement level of the recent wave from the $3,343 swing low to $3,628 high. Any more losses could lead ether price towards the $3,425 support zone and the 100 hourly simple moving average.
Technical Indicators
Hourly MACD – The MACD for ETH/USD is slowly moving in the bearish zone.
Hourly RSI – The RSI for ETH/USD is now above the 50 level.
Major Support Level – $3,425
Major Resistance Level – $3,575


