
Bitcoin extended its rally above the $57,000 against the US Dollar. BTC could continue to rise if it is above the $56,000 support zone.
- Bitcoin is trading in a positive zone above the $56,000 support zone.
- The price is now trading above $56,000 and the 100 hourly simple moving average.
- There was a break above a key declining channel with resistance near $55,400 on the hourly chart of the BTC/USD pair (data feed from Kraken).
- The pair is correcting gains, but the bulls could remain active near $56,000.
Bitcoin Price Eyes More Upsides
Bitcoin price remained well supported above the $55,000 pivot level. BTC gained pace and it was above to clear many hurdles near the $55,500 level.
There was also a break above a key declining channel with resistance near $55,400 on the hourly chart of the BTC/USD pair. The pair climbed above the $56,000 resistance level and settled above the 100 hourly simple moving average.
There was also a break above the $57,000 level and the price traded as high as $57,837. It is now correcting lower and trading below $57,500.
There was a break below the 23.6% Fib retracement level of the upward move from the $54,396 swing low to $57,837 high. On the downside, an initial support is near the $56,200 level. On the upside, the bulls are facing resistance is near the $57,000 level.
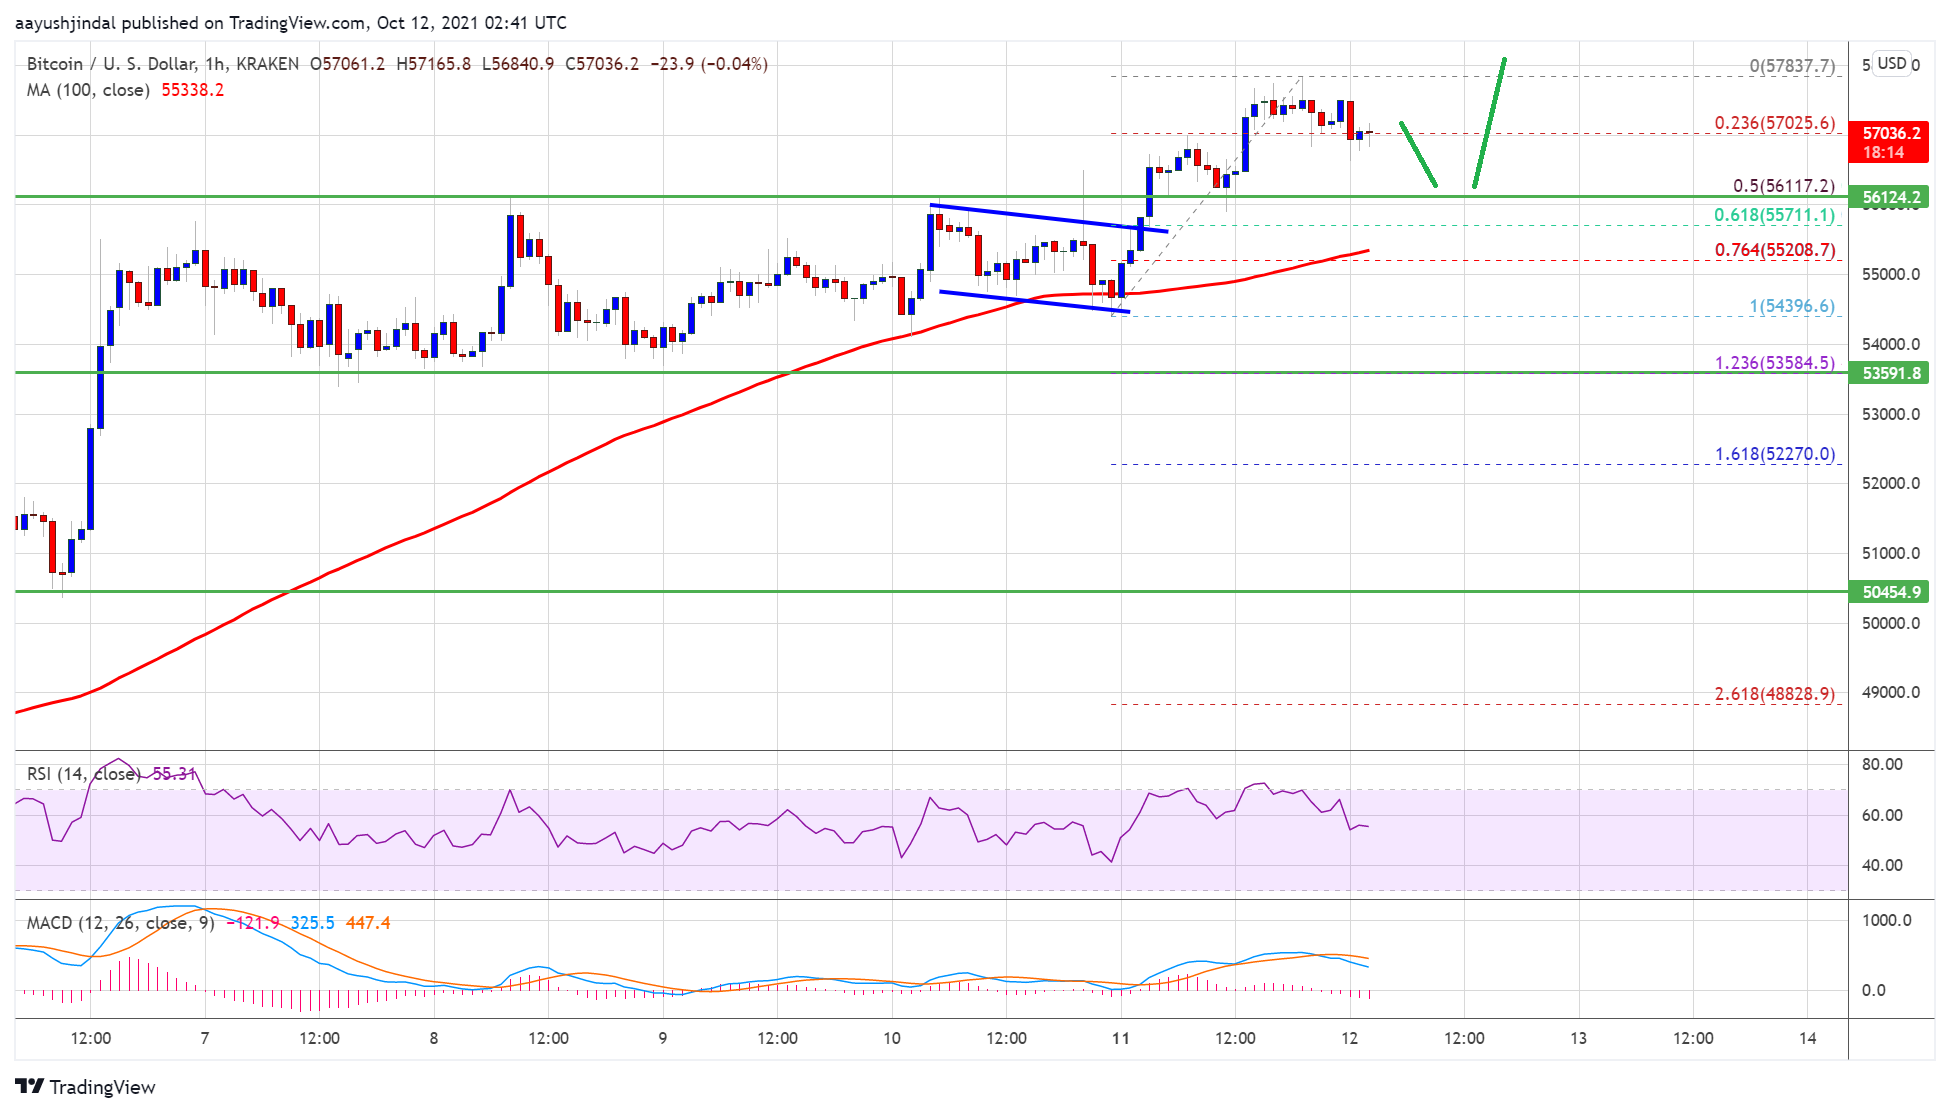
Source: BTCUSD on TradingView.com
The first key resistance is near the $57,500 level. A clear break above the $57,500 resistance could open the doors for a decent increase. The next major resistance sits near the $58,500 level. Any more gains could set the pace for a move towards the $59,200 level.
Dips Supported In BTC?
If bitcoin fails to clear the $57,500 resistance zone, it could correct lower. An immediate support on the downside is near the $56,200 level.
The first major support is snow forming near the $56,000 level. It is near the 50% Fib retracement level of the upward move from the $54,396 swing low to $57,837 high. A downside break below the $56,000 support zone could open the doors for a larger decline.
Technical indicators:
Hourly MACD – The MACD is slowly gaining pace in the bearish zone.
Hourly RSI (Relative Strength Index) – The RSI for BTC/USD is now near the 50 level.
Major Support Levels – $56,200, followed by $56,000.
Major Resistance Levels – $57,000, $57,500 and $58,500.


