
Bitcoin price failed to stay above the $62,000 support against the US Dollar. BTC could decline heavily if it breaks the $60,000 support zone in the near term.
- Bitcoin failed to surpass $62,500 and started a fresh decline.
- The price is now trading below $62,000 and the 100 hourly simple moving average.
- There was a break below a key bullish trend line with support near $61,500 on the hourly chart of the BTC/USD pair (data feed from Kraken).
- The pair could accelerate lower if there is a clear break below $60,000.
Bitcoin Price Faces Resistance
Bitcoin price attempted an upside break above the $62,500 resistance level. However, BTC failed to gain strength above $62,500. A high was formed near $62,950 and started a fresh decline.
There was a clear break below the $61,200 and $61,000 support levels. There was also a break below a key bullish trend line with support near $61,500 on the hourly chart of the BTC/USD pair. It is now trading below $62,000 and the 100 hourly simple moving average.
The pair even spiked below the 50% Fib retracement level of the upward move from the $58,140 swing low to $62,950 high. On the upside, an immediate resistance is near the $61,000 level.
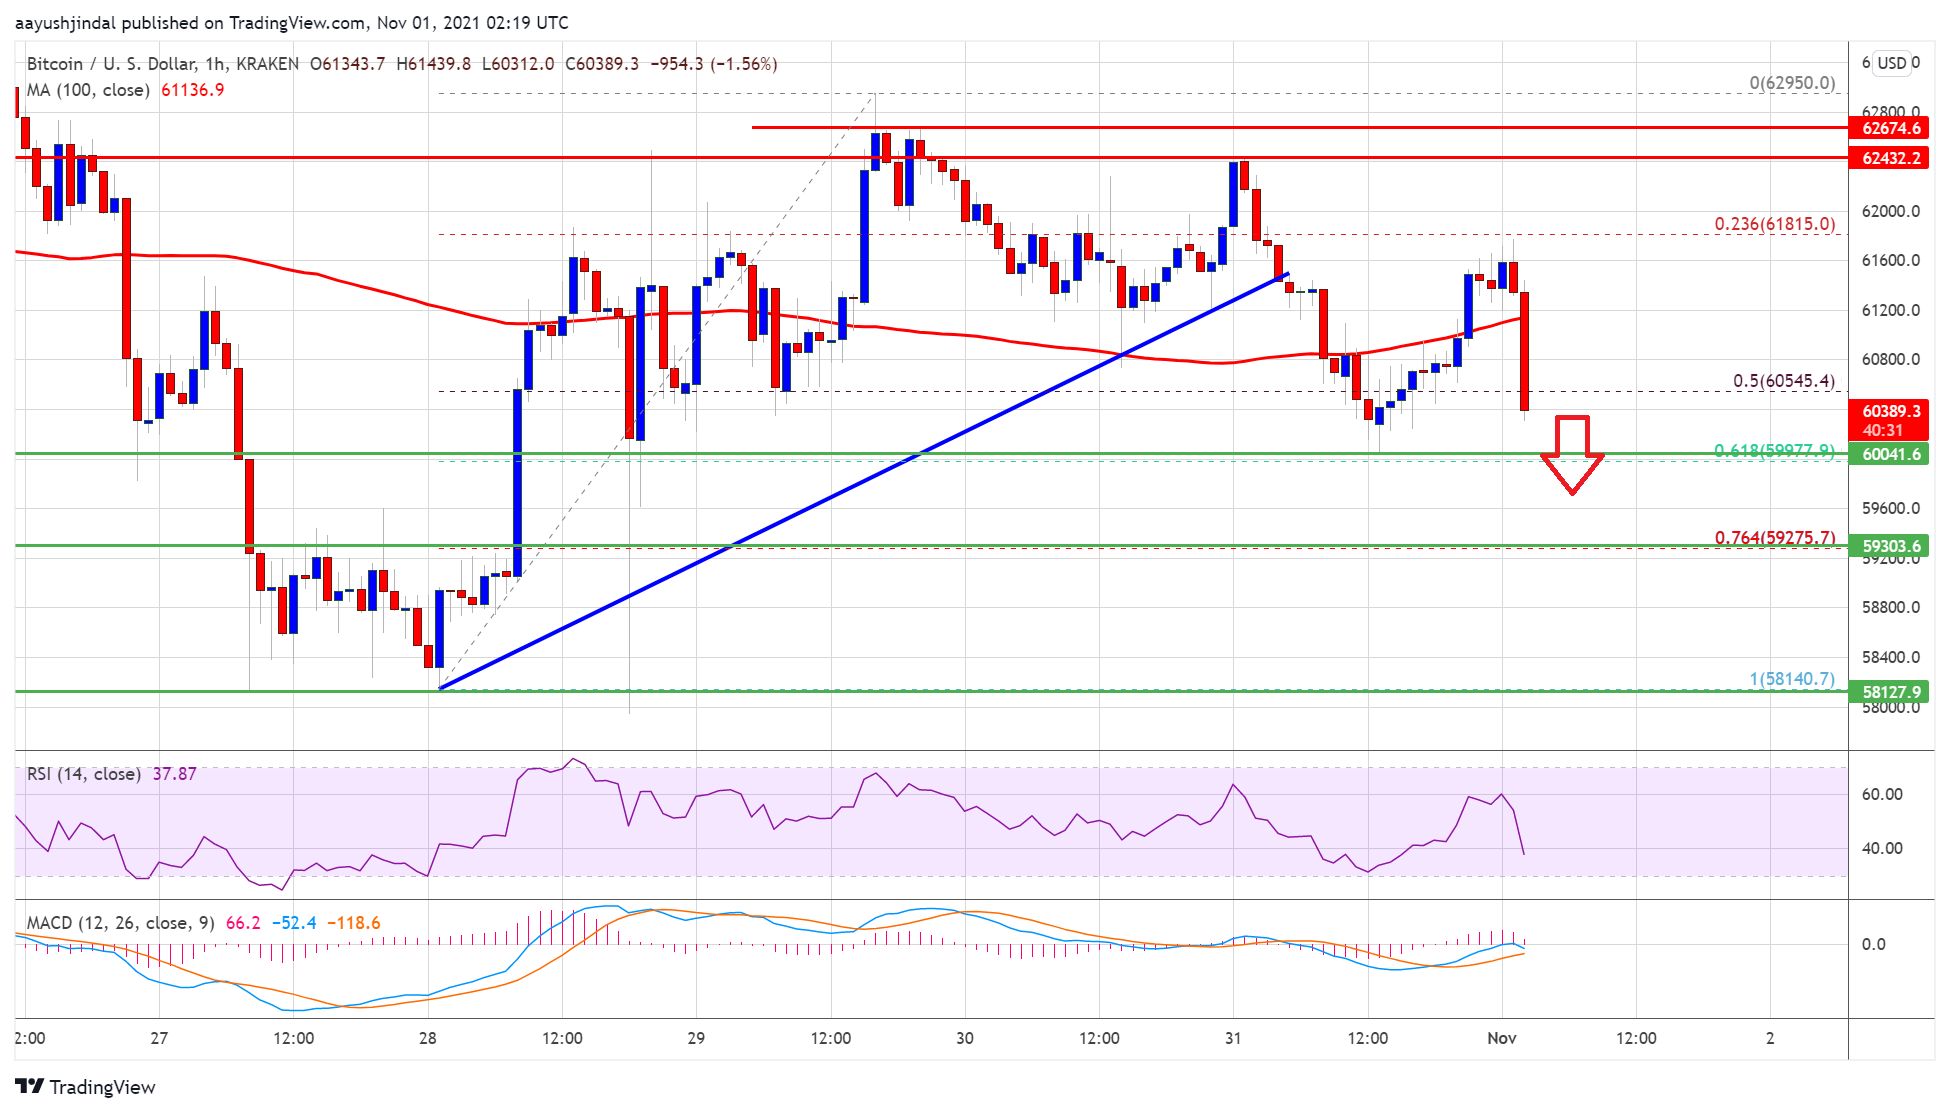
Source: BTCUSD on TradingView.com
The first major resistance is near the $61,200 level and the 100 hourly SMA. A clear break above $61,200 resistance may possibly call open the doors for a move towards the $62,000 level. The next major resistance sits near the $62,500 level. A close above $62,500 might start a steady increase.
More Losses In BTC?
If bitcoin fails to clear the $62,000 resistance zone, it could extend its decline. An immediate support on the downside is near the $60,200 level. The first major support is now forming near the $60,000 level.
It is near the 61.8% Fib retracement level of the upward move from the $58,140 swing low to $62,950 high. A break below the $60,000 support may possibly spark a sharp decline. The next key support is near the $58,500 level. Any more losses might call for a move towards the $55,000 level.
Technical indicators:
Hourly MACD – The MACD is slowly gaining pace in the bearish zone.
Hourly RSI (Relative Strength Index) – The RSI for BTC/USD is now below the 50 level.
Major Support Levels – $60,200, followed by $60,000.
Major Resistance Levels – $61,200, $62,000 and $62,500.


